

Scoring and Evaluation Algorithm for MD Simulation Data
Scoring and Evaluation Algorithm for MD Simulation Data
Overview of Algorithmic Workflow
To quantify and compare the stability of each replicate in the molecular dynamics (MD) simulation of the 5‑HT₂A receptor, we implemented a scoring algorithm that extracts and summarizes several key metrics:
- Backbone RMSD
- Cα RMSD
- Side‑chain RMSD
- Radius of gyration (Rg)
- Root mean square fluctuation (RMSF)
- Principal component analysis (PCA) projections
Input files are standard GROMACS .xvg files, organized by replicate number and parsed using custom Python utilities.
Metric Extraction and Averaging
For each metric, only the latter half of the simulation (50 % of the total time) is used to compute average values and standard deviations. This focuses analysis on the equilibrated portion of each trajectory, reducing bias from initial relaxation artifacts. Each metric is:
- Extracted from its
.xvgfile - Validated for formatting consistency
- Transformed into a numerical
pandas.DataFrame
Justification and Interpretation
This scoring algorithm balances interpretability with quantitative rigor:
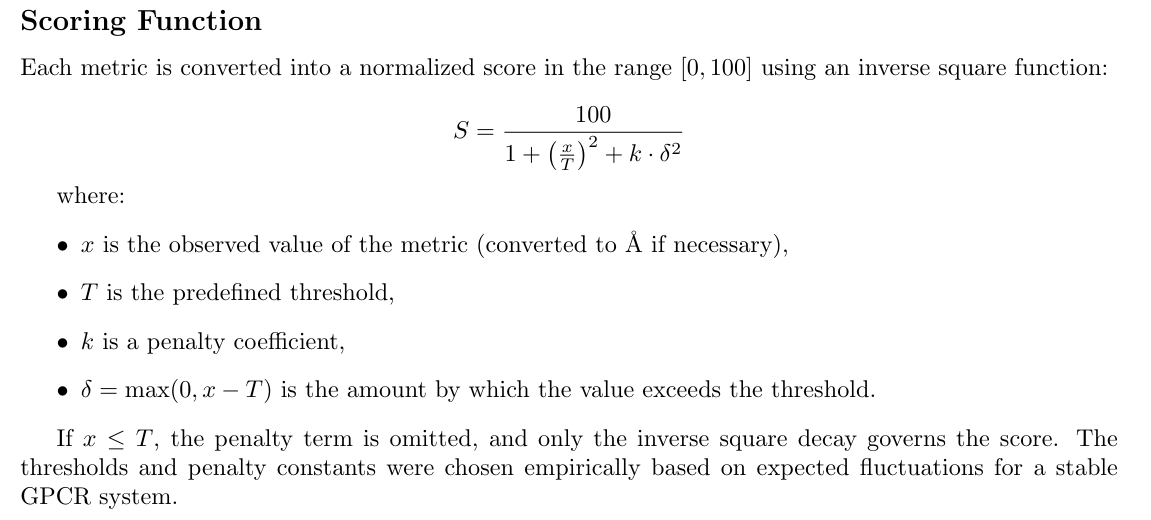
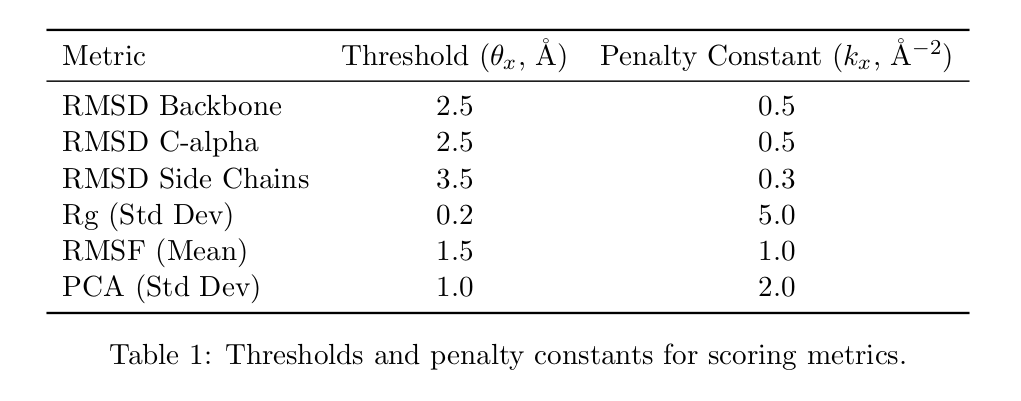
- Penalty for large deviations: Any metric exceeding physiological thresholds is penalized via (\delta).
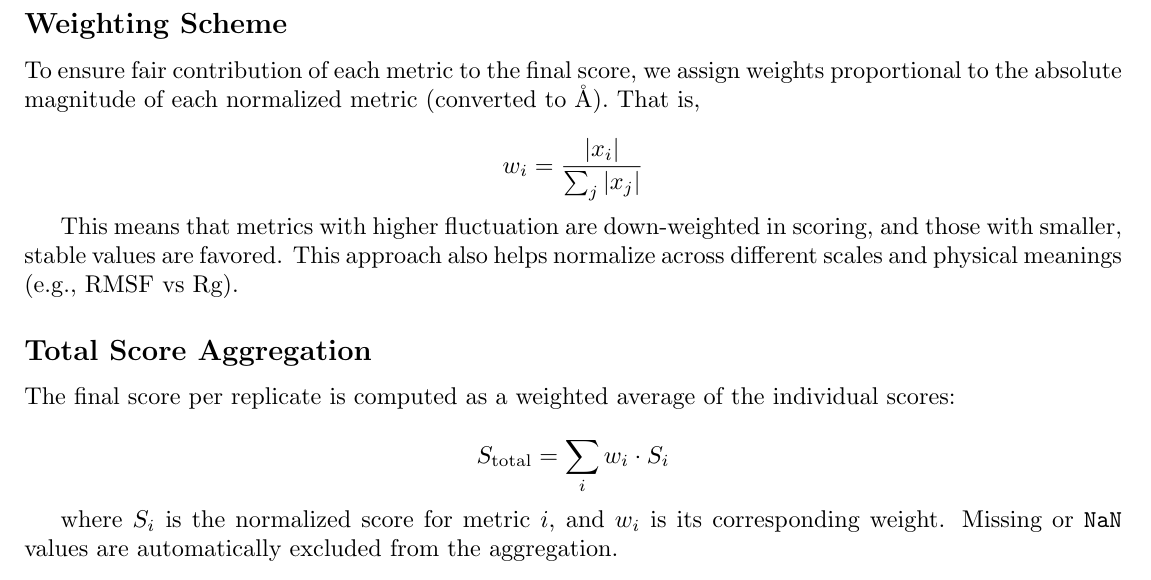
- Balanced weighting: No single metric can dominate unless it exhibits truly large variation.
- Equilibrated focus: By analyzing the second half of each trajectory, we minimize artifacts from initial relaxation.
Together, these design choices enable:
- Meaningful comparison between replicates
- Rational selection of representative structures
- Filtering of unstable trajectories prior to downstream analysis